Full size [13.44 KB]
GOES_PLOT_24h.doc
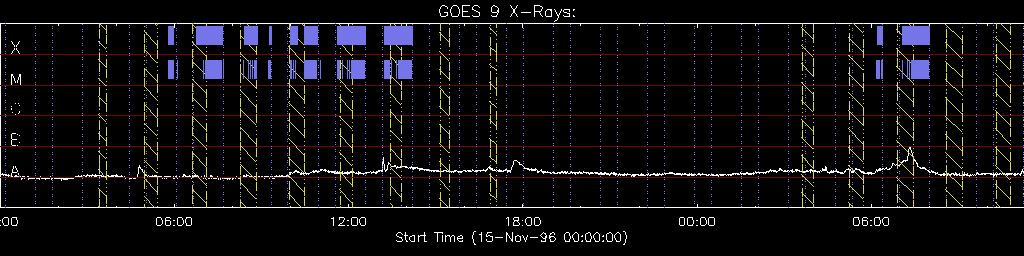
This is a plot of GOES 3 second data which includes the data from 00:00 UT 'Yesterday' though the most recently obtained data (usually 3-4 hours old).
Several Yohkoh and SXT events may be overlayed on the plot, such as...
Regions between dotted lines: Yohkoh S/C Night Regions filled with diagonal lines: Yohkoh South Atlantic Anomaly (SAA) Passage Vertical ticks labeled PFI: Partial frame SXT images received Vertical ticks labeled FFI: Full frame SXT images received
[The SXT data times over this short time only reflect data acquired at the Kagoshima Space Center, Japan. This data is reformatted and available online in near real time. Additional data from the NASA operated Deep Space Network is played back later and would fill in most of the apparent gaps]